First light... 2nd January, 2011
.jpg)
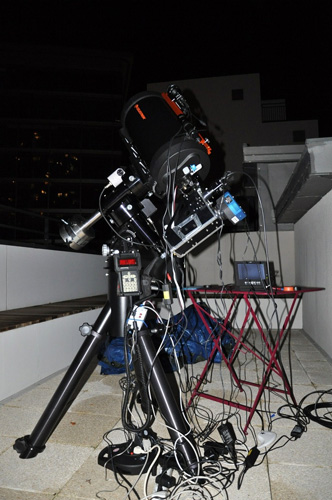
Paris Saint-Charles Observatory... the setup is for flat images, and behind the buildings, the Eiffel Tower top and its lightning. With my friend Christian Buil. |
A crazy bet... find an appartment in Paris 15th district with a terrace and be able to do astronomy. And one day...
First light... 2nd January, 2011
Paris Saint-Charles Observatory... the setup is for flat images, and behind the buildings, the Eiffel Tower top and its lightning. With my friend Christian Buil. |
Set in the fithteenth arrondissement of Paris, street Saint-Charles, near the Boulevard de Grenelle and about 900m from the Eiffel Tower, the apartment on the 3rd floor has the distinction of having a terrace "roof". The staircase in the living room giving from the floor on a small loggia that opens itself actually on two terraces. One to relax and the other converted into an observatory. Being at the height of a fourth stage, the site is surrounded by about 5-6 storey buildings, with a horizon a little more open towards the south-east and an office building with 8 floors west side. The offices ligths are extinguished at night.
More images can be seen on Flickr
Besides light pollution, the site seems quite "turbulent" with the surrounding rooftops and forced airflow out of the building. In winter, all the air vents are blowing hot air certainly, there are areas that will requiresome further attention to identify and monitor
The telescope is a C9 SC version on a mount Astro-Physics Mach1 GTO, and a pier Losmandy. The set was purchased from F. Valbousquet - Optics and Vision - Juan-les-pins. The installation and start-up have had no problems except the need to add counter-weight. The entire spectrometer and cameras have a higher weight compared to conventional instrumentation.
The spectrometer is a LhiresIII, from Christian, with a grating of 1200tr/mm and a slit of 35 microns. The CCD camera is a QSI583. For guiding, a Watec 120N is used with a WiFi interface to control the gain without having to move. The whole comes from the company society Shelyak Instruments from our friends François Cochard and OlivierThizy.
The PC and so the control is made from the loggia, in warm envirronement. Only an USB cable is departing from there to the telescope.
 |
|

Christian Buil, serving in his second observatory ... |
A digital finder was mounted at the front of the optical tube. There is a second camera with a Watec and a nikon lens of 50mm opened at f/1.4 - the video signal is sent to a small TV monitor. The lens focal is a little weak. It would rather need a 100 or 135mm but proves useful tools at this moment. To the naked eye it is already difficult to find a star near the 3rd magnitude... So the essential is to have a good finder, sensitive and above all a good mount that can point accurately once the calibrations are made. It was a total success, the Mach One is a swiss clock ... Polar adjustment was made during a previous night, using one of the methods proposed in the manual (pointing alternately from polar and a star to + or - 4hrs difference from the polar Right Asc - "Calibrating With Polaris "). Guiding also proved excellent.
In the picture below, you can see the field of view of the digital finder with its lens of 50mm and the magnitudes of some faint stars around Epsilon Aurigae.
 |
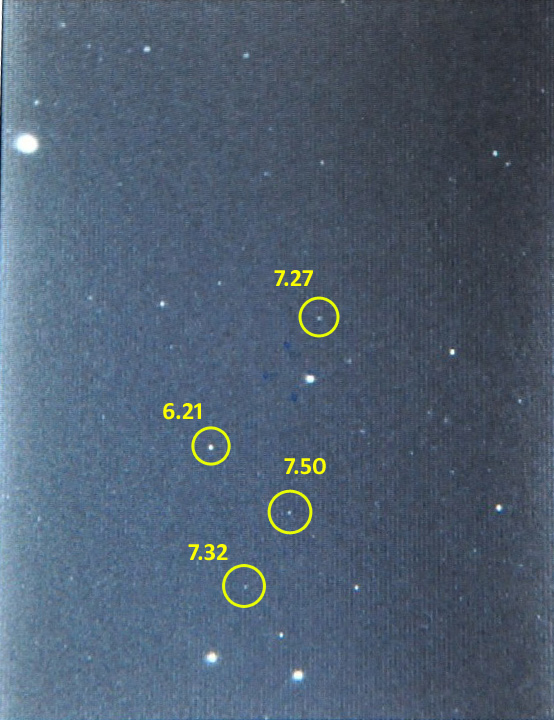
Epsilon Aurigae region - the star around magnitude 7 are quite noticeable. We can see the blue marks that identify the position of the slit of the spectrometer. |
.jpg)
Field of view on the TV monitor from the digital finder
Same, but during the passage of the light from the Eiffel Tower ... |
The overall diagram of the experiment is classical but requires a lot of wiring. This part should be reviewed and optimized. The control pad of the Mach1 is connected to the PC via an RS232-UBS Serial converter.
 |
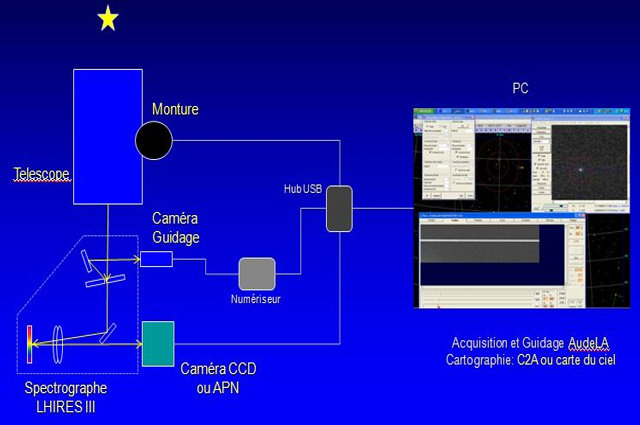
The wiring diagram of the spectrometer - the USB Hub is at the bottom of the telescope. A single USB cable if going to the inside part of the building. The guiding camera, the CCD camera and control of the mount are connected to the hub. |
The remote control is done through AudeLA. The auto-guiding of the star on the slit of the spectrograph was immediate! with the new version of AudeLA it became very easy to define the position of the slit on the image of the digital video Watec. The protocol to control the Mach1 is LX200 with the driver Astro-Physics. The only operations that are not controlled remotely are focusing (but it will be possible with the Robofocus) and the ignition of the neon lamp for spectral calibration.
The sky has offered a short clear sky window. The first star pointed was a bright star, Capella. This is not ideal for the instrumental response curve because Capella is a "cold" star of spectral type G5III which has many lines in its continuum. We followed up with the famous star Epsilon Aurigae, which is an eclipse phase and which we know little about the eclipsing object, and finished in extremis with Zeta Tau, the Be star by excellence.
5 exposures of 10 secondes each... good enougth for a 0.08 magnitude star. The slit is 35 microns, which is wide enough but it was preferred for a first test. The flux has been favored over (light) decrease of the resolution. Sampling is .4 ang / pixel

Raw exposure of 10 sec |

After processing- 5 exposures of 10 secondes so a total duration of 50 secondes |

Capella spectrum - pectral range of 680 angstroms, between 6280 and 6960 Ang. - The H-alpha line is at the center, the absorption band of molecular O2 atmosphere is visible in the red part, at right. |
7 exposures of 180 secondes each - Eps Aur is a 3.03 magnitude star but has the specificity of being a variable star, an eclipsing one.
The period of the eclipse is 27.1 years and its duration is unusually long, almost 2 years. The star is currently at the end of the eclipse phase, which started around August 2009. Despite the many professional and amateur observations, photometry, polarimetry spectrometer, the nature of the eclipsing object remains a mystery. A disk of gas, a companion object ? No one knows for sure, but each eclipse brings answers and new questions. To follow the details of this object, we must refer to the website specialized on the 2009 campaign here. The goal is for practicers of spectroscopy to take spectra as regularly as possible in order to monitor changes in the profile of spectral lines and to deduce informations on the speed, composition and physical parameters of the system Eps Aur. The spectrum obtained here will be sent to Robin Leadbeater, English enthusiasts astronomer amateur who collects the data and makes a preliminary analysis of the results.

Raw exposure of 180 s - the signal level is around 20000 - background around 400 |

After processing - 7 cumulated exposures of 180s, total duration of 21 minutes |

The spectrum of Esp Aur - spectral range of 680 angstroms, between 6280 and 6960 Ang. - The H-alpha line is at the center, there is an emission peak on the red wing of the H-alpha, which evolves during months. |
4 exposures of 300 seconds each - Zet Tau is a star of magnitude 3 and spectral type B4IIIe - the "e " is for emission as its H-alpha line is in emssion in the opposite of normal B stars of the same luminosity class (non-super-giant).
Zeta Tau is a binary star, well known to spectroscopists amateurs and a prototype of Be star which has a variable line profile over months. It could refer to the spectra of the base BeSS Meudon from Arasbeam amateur site here. The first spectrum amateur Zet Tau was done by myself and Daniel Bardin T60 at the Pic du Midi in February 1991. The spectrum obtained will be loaded in the database BeSS.

Raw exposure of 300s |

After processing - 4 cumulated exposures of 300s, total duration of 20 minutes with large clouds crossings at the end of the observation. |

The spectrum of Zet Tau-The H-alpha emission is in emission with a strong central absorption. Note the line of helium at 6678 angstroms. |

The current H-alpha is in blue (0.4ang/pixel) and in purple the profile in February 1991 with the spectro Bardin (1Ang/pixel) |
There are no correct observations without making a "flat " or uniform field of light to find dust attenuation. The method used is an halogen lamp on a tripod placed at a distance of one meter from the entrance of the telescope. The front of the telescope is covered with tracing paper to diffuse the light. The Halogen lamp has a continuous spectral response and thus do not produce spectral lines in the image.

Flat - Median sum of 11 images - unitary exposures of 10 seconde - a dust probably on the slit causes the absorption near the center of the image. It is useful to identify that location to avoid placing the star in the slit. It would be a guaranteed loss of flux |

The powerful halogen lamp which may raise doubts in the neighbors that we really do in these place scientific astronomy ... |

An astronomer from Toulouse ensured delivery of the spectro and the assembly of the lamp for the flat |
the sampling of 0.4 ang / pixel gives a medium-resolution spectrum. Capella has been used to calculate the instrumental response. For that, it was found in the professional database Elodie a spectrum of Capella in fits format, but the slow variations on the continuum remains suspect for flux calibration. It was chosen a spectrum from the library of Visual Spec, at spectral type G5III. Using Visual Spec the response was then extracted by comparing the refrence spectrum with our recorded spectrum.

In blue, the spectrum of Capella obtained and in purple the spectrum G5III from the library of Visual Spec (Pickles) |

Instrumental response curve extracted with Visual Spec - It is then used in RLhires processing |
The spectrum of the Elodie databse has a sampling of 0.05 ang / pixel and can be compared with the observed spectrum. We will ignore the variations of continuum and the missing pixels in the Elodie profile in this comparison. One can see that the main group of lines are present, properly calibrated and therefore this spectrum is reliable.

In red, the spectrum of Capella obtained and in light blue the Elodie spectrum. Many lines are present, because the temperature of a G5 star is in the order of 4700 ° K |

Zoom on region 6400-6580 - comparaison with an Elodie spectrum |

Zoom on the region 6510-6589 - compared with a theoretical spectrum generated by the software Spectrum at a step of 0.1 angstrom. The lines seen on the real spectrum are actually a multitude of unresolved lines. It is dificult in these circumstances to say exactly what the element is responsible for those lines. Given the spectral type they are probably iron lines. |

With Visual Spec, superposition of Iron spectral lines |

Spectrum of Epsilon Aurigae - spectral range between 6280 and 6690 angstroms |

Zoom on the H-alpha region - the peak is shifted toward the red by about 2.5 Angstrom, which correspond to a Doppler shift of 115 km / s |
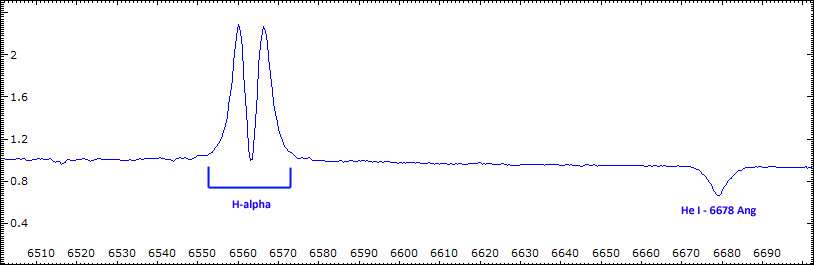
Spectrum of Zeta Tau - spectral range between 6500 and 6690 angströms |

Compilation "2010" of H-alpha lines from Zet Tau - no heliocentric correction |
Do "scientific" spectroscopy near by the Eiffel Tower is possible ... With a spectrograph, we look at sky through a very narrow range of wavelengths, so it is less sensitive to light pollution. It's like making images with filters, if the lights are not emitting at these wavelengths, the sky is (almost) black.
Turbulence can be a bigger worry. Tits impact will reduce the signal to noise ratio as the stars will be in-out of the slit and be also no focused.

"You'll see, a rooftop terrace will be like a small observatory"
|

.jpg)